A couple of months ago, I had the opportunity to redesign the route map for a major airline, to be printed in their in-flight magazine.

This is not the final product that I ended up creating for the client, but it’s my favorite iteration, and the one that I want to talk about today. I just want to break down a few elements of how and why this came together the way it did: a little behind-the-scenes of my work and thought processes.
Cartogram
As I began exploring layout options for the project, I started with a simple Gall Stereographic projection.

But I quickly ran into a couple of challenges, due to the demands of the two-page print spread that I needed to fit this map into.
- Gutter: There’s a fairly wide gutter in the middle of the spread, where the pages are bound together. No cities or labels or other important stuff can fall within that zone. That leaves me with very few ways to non-awkwardly divide the map into two pages. The above image is one of the only options. In fact, I had to widen the Atlantic Ocean a little bit just to make it work — Iceland and Greenland are much closer together in reality. The end result is that the whole thing is kind of unbalanced. The vast majority of the routes are on the right side.
- Scale: The whole map has to fit within 398 × 270mm (15.7 × 10.6in). That seems like a fair amount of space, but, because of the distribution of the airline’s flights, some areas, such as Europe, are very densely packed. Far too crowded to label.
So, I decided to take a different approach. Instead of being beholden to reality, and the true size and shape of the Earth’s landmasses, I made a cartogram. By resizing and reshaping different areas, I could both alleviate overcrowding and better distribute the world on either side of the gutter.

I widened a portion of Asia, just west of India, in order to make space for the gutter. I shrank areas where there were fewer destination cities, and expanded those that had more. But despite all the distortions, it looks (to me) still reasonably familiar. Cartograms tread a fine line between reshaping the world and keeping it recognizable, and I think that I did OK here. The extent of the distortions becomes much more apparent when you run it through Bernie Jenny’s MapAnalyst.


To make the cartogram, I started with the Gall Stereographic map in Illustrator. Then I simply selected chunks of land and resized/moved them until I was happy. I made heavy use of the Lasso tool.

I would shrink an area here, expand or shift one there. It was an iterative process over the course of an hour or two, changing a piece at a time and seeing the effect it had on the other pieces. The end result looked terrible and jagged, due to the way it was constructed, but it had everything in approximately the location that I wanted it.

To clean up all that roughness, I then redrew a new, tidier set of linework on top of the distorted map. I built mine out of straight lines and circular arcs, much like the Geo-Metro set I did for Project Linework. It gives things a modern, urban feel. I think it keeps enough detail to make places seem familiar, while smoothing over a lot of details that had to be distorted.

Finally, I nudged around some of the city dots. Since the linework I drew didn’t exactly match the (now-distorted) coastline, some coastal cities had moved a bit far from the sea. In other cases, I shifted them a little bit just to make more room for labels.
Root and Branch Lines
I began the project determined to avoid the clutter that characterizes so many flight maps. Major airlines have a lot of connections, and drawing each possible route can lead to a tangled mass of impossible-to-follow lines.

That’s an extreme example, but you get the idea. These things can get out of control quickly, and the map ends up not really being useful as an informational tool.
My client had far fewer flights than United, and fortunately almost all of them originated in Dubai. But, even then, showing every line could lead to chaos (if a lesser degree of it). So, instead, I created a root-and-branch structure. Lines to each city were bundled together (as though with cable ties) and routed through empty spaces. I also gave everything an elegant, flowing curvature. It’s sort of plant-like.

This was another iterative process. I’d draw a root, then start to add branches to it, then figure out a better routing and start that section over, or I’d decide another root was needed to keep things tidy, etc. It took quite some time. As a starting point, I mostly just looked for open spaces that had a good balance of cities on each side.

Smooth Line Joins
Getting the lines to join smoothly also took a some work. I couldn’t just quickly connect the city lines to the bundled lines — I wanted them to flow into each other. This meant adjusting the curvature on each line carefully until things looked right. Basically, I had to set the bezier handle of the thinner line to be tangent to the curvature of the thicker line at the point where it joins. To explain this, I’ve put together some diagrams that approximate (a nicer version of) Outline Mode in Illustrator, which shows you just the bare vector paths, with no styling.

That looks much better. But, there’s still one issue. These paths are styled with strokes, and those strokes have widths to them. So, in reality, it’s more like this:

Now things don’t look quite so smooth. There’s a little bit of a non-organic-seeming corner on one side where the lines come together. When I did my manual smooth join, I didn’t really account for the fact that the edges of the stroke are a short distance away from the center of the stroke.
So, instead of connecting the branch straight to the root, I need to connect the branch a short distance away from the root, so that the right edge of each of those two strokes will be in alignment with each other. The roots have a stroke width of 3pt, and the branches are 1pt, so if I do a little math, it turns out that I want to connect the branch to something that’s 1 pt away from the center of the root, and it’ll all work out.

By shifting the branch up a little bit, now its right edge is in alignment with the right edge of the root, and they flow together well. How did I place it exactly? I used the Offset Path tool to make a new version of the root line, 1 point away from the old line. This is a little different than just shifting the line left or right by 1 points. It’s more like creating a buffer around the line, 1 point wide. Offset Path is great, and I use it a lot (often to make waterlines).

The end result is a nice smooth set of flowing lines. It’s a really little touch. But, so much of good mapmaking inheres in the small details, doesn’t it?
Gradients on Strokes
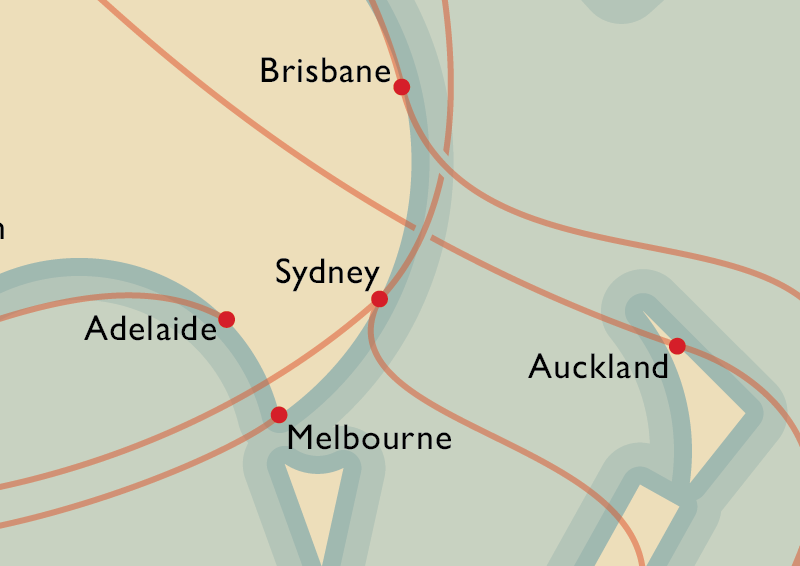
You may have noticed that some cities are red and some blue — the former are the client’s flight destinations, and the latter are those of one of their major codeshare partners. I wanted to show the flights to the codeshare cities in a matching blue, but it would have looked awkward to just join a blue line straight into a red trunk.

So, instead, I applied a gradient stroke to each of the codeshare lines, so that they were blue near the dot, and red near the root. I had to adjust each gradient manually; since each line was a different length, I couldn’t simply say, “make it red for the first 10% of the line.”

The end result gives us a fairly-smooth transition between roots and branches when we need to use blue.
Fun fact: one alternate version of the map that we looked at also used gradients, but this time for opacity. Each city had a separate arc line running toward Dubai, but the lines became invisible shortly after leaving the city, to hint at their destination while avoiding a lot of overlap and clutter. I used the same gradient panel in Illustrator to do this, keeping the color constant but changing the opacity for the middle portion of the line. It was a fun idea, though ultimately we decided not to use it.

I’m pretty pleased by the overall result of the root and branch style. It both shows the extensiveness of the network, and allows the reader to easily figure out which cities connect to which other cities. It’s relatively clutter-free. Again, I had a little bit of an easier job than the designer of that United Airlines map I showed above — I have fewer cities to deal with, and most of them connect to the same place. But I suspect that this style would still yield some benefits on a more crowded network; even if it might not make everything 100% clear, it would probably still help a lot.
Coloration
My initial draft of the map started out with a much brighter color scheme for the basemap, and bolder lines.

Fortunately, I solicited the ever-valuable advice of my colleague Tanya Buckingham. She said it felt a little childlike to her, which I started to agree with as I looked at it. Over the course of about twenty minutes, we slowly adjusted the palette to look a little more mature and refined. Mostly this was driven by her; she had a particular shade in her mind and we kept trying to match it.
I also gave the route lines some transparency. This was actually done out of necessity on a later draft of the map, one that was much more crowded and which needed the lines to fit comfortably underneath the labels, rather than dodging around them. But I liked the look of it, and so I went back at the end and applied the change to the cartogram, long after we’d abandoned it, and I think it helps. It makes the route network seem much less vascular.
Odds and Ends
I tried to avoid crossing lines, but there were a couple of places where it was necessary. In those cases, I added little breaks to help make it clearer that these did not connect.
Given the distortions in the cartogram, I threw in a couple of ocean labels to help remind people of the geography they were looking at. If I’d done another draft, I might have also included some continent labels, as well. Just little context clues.

Finally, I wanted to show you a couple of the other maps in this project. Besides making a world map, I was also tasked with making a series of half-page regional maps, as well. Here, I took a page from the work of folks like Erwin Raisz and Richard Edes Harrison and did a series of perspective views.


I used both Orthographic and Vertical Perspective projections to create five regional maps. It’s an immersive viewpoint that I find very powerful. These kinds of projections always suggest the concept of distance and travel to me, by showing the far-ness of some place on the horizon. It also feels like flying, positioning the reader high above the Earth (though the eye is more at space travel height than airline height).
Concluding Thoughts
In the end, the client eventually preferred a more traditional representation, including a non-cartogram world map, and non-bundled flight lines, though we did keep the perspective views. That’s the nature of this business: there’s often a lot of stuff that gets discarded as drafts are done and different visions explored. Sometimes the artist’s favorite versions don’t make it to print; that’s something I find challenging about being a creative professional. But, this blog gives me a place to show off and talk about something that might not otherwise have had an outlet. I hope you found it interesting or useful!
This project walkthrough is, and will remain, free, but if you derive some value from it, you are welcome to make a donation to support my continued work.

I love your work. Do you have a background in graphic design in addition to cartography?
Thank you for the kind words. I have no particular graphic design background, but some of the same concepts are covered in cartography courses. And are also floating around among the cartographic community, in general.
Great work Daniel! Ever since I was a kid I was fascinated with the airline route maps inside the inflight magazine. Your version here is by far the best one I’ve ever seen. It is too bad that the client went with a more traditional map, but I’m glad you shared your creativity here. Thanks!
Great design and walkthru, thx for sharing! Luv ur immersive views, even if as you say they were left on the cutting floor.
I am 12 years and love maps. Found this site by watching a video on Youtube. Learned a lot. Can you tell me what type of font did you used on this map?
Welcome! I used Gill Sans, which I picked because it’s one they had used on the previous version of their map.
Completely fascinating! To me your map has a look of early maps of the world (this is meant to be a compliment) where land masses were different shapes to those we depict now. It gives an air of discovery in tune with these old maps, of being an explorer setting out to exciting new parts of the world. And the curving route lines echo the curving lines of Arabic script and lend an elegance and flow which will hopefully be reflected in the customer experience of the airline. The curving branches also echo the organic theme of discovery. I would be much more enticed by this route map than a traditional one – it just has so many rich associations.
I hadn’t considered it this way, but thanks for sharing. It’s always interesting to hear additional interpretations, since the experience is so individual!
Beautiful work! I particularly love the regional versions. You don’t have a European one that you can also share?
Thanks! I’m afraid I did not create a European version of the root-and-branch style before the client decided that they wanted to do something different.
Hey Daniel,
Thanks for sharing this great article. Love the map. I saw your map was included in the Atlas of Design. Congrats on that. I also submitted but more for sport. I didn’t expect the map I submitted to be included. Next time though!
Have fun! Chiel
>
There’s a mistake on your map. Russia has two cities of Rostov, and you choose the wrong one.
https://en.wikipedia.org/wiki/Rostov-on-Don
https://en.wikipedia.org/wiki/Rostov
I’m so sure because the one you’ve chosen doesn’t have an airport
Alas you’re right. I ran a long list of cities through a geocoder, and these things happen sometimes with those. Now I need to make sure this error didn’t make it to the final map!
What a beautiful map! Thanks for sharing how you ended up with the finished article; such an interesting process. I love aviation but have zero graphical skills!
Hi, Daniel! I’m an editor of a Russian resource about infographics (Infographer.ru). I was impressed by your work and re-posted it on our facebook page. And our readers asked me to translate it into Russian. So I did. I hope you don’t mind!
That’s perfectly fine; thanks for letting me know, and thank you for the kind words!
Hi Daniel,
I came back to your website to find your contact information and got pulled into your description of this project. The methodical approach combined with the graphics were quite enjoyable. The details about setting the gap between curved lines and graduating the colors of those lines was a helpful reminder, while the whole project was a good example of distilling multiple influences. Thanks.
David
Great map Daniel. May I ask how you imported the GIS data into illustrator in the first place? I assume you had a .shp of the world to begin with?
I did start with a .shp of the world, I think from Natural Earth. Most maps of mine involve starting in QGIS or ArcMap and then exporting from there to an Illustrator file and doing the actual cartographic work on that end. Both programs have the ability to export to a vector format. ArcMap exports to a somewhat-outdated version of Illustrator, but it works alright. QGIS exports to PDF or SVG formats that can be cleaned up and make to work in Illustrator.
grand, thanks Daniel